Impress employers and recruiters.
Choose from hundreds of resume examples.

Impress employers and recruiters.
Choose from hundreds of resume examples.
Tailor your resume to this Senior Observability Platform Engineer - Alerting role.
Rezi rewrites your resume against CACI's job description. Free.
Tailor your resume to this Senior Observability Platform Engineer - Alerting role.
Rezi rewrites your resume against CACI's job description. Free.
Don't guess if your resume is good enough.
See how it scores against the Senior Observability Platform Engineer - Alerting posting at CACI — free, in seconds.
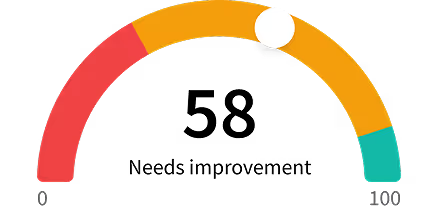
Don't guess if your resume is good enough.
See how it scores against the Senior Observability Platform Engineer - Alerting posting at CACI — free, in seconds.
About the Role
The Senior Observability Platform Engineer is responsible for transforming telemetry into actionable dashboards, alerts, service-level objectives, incident workflows, and reliable operational outcomes. This role integrates telemetry, alert engineering, platform reliability engineering, incident-management support, and observability user enablement to ensure effective data utilization by various stakeholders.
Responsibilities
- Deploy, administer, secure, and maintain Grafana as the primary visualization and alerting interface.
- Build and maintain role-based dashboards for platform engineering, SRE, security operations, application teams, FinOps, and leadership.
- Design, implement, tune, and maintain alerts for availability, performance, saturation, errors, security events, telemetry gaps, storage issues, and SLO violations.
- Establish alert standards, severity definitions, deduplication, grouping, inhibition, routing, escalation, silencing, suppression, and maintenance-window practices.
- Define, implement, and maintain SLIs, SLOs, error budgets, service-health standards, and reliability reporting for onboarded services.
- Build and maintain meta-monitoring dashboards, including pipeline throughput, dropped samples, query latency, ingestion rate, storage utilization, node health, alerting status, and identity-provider health.
- Write and optimize PromQL, LogQL, TraceQL, Elastic Query DSL/KQL, or other relevant query languages based on the approved platform architecture.
- Partner with application teams to build RED-method dashboards, service-level monitoring, trace-to-log correlation, and deployment-aware operational views.
- Work with IAM, security, and data-governance stakeholders to implement appropriate dashboard, query, and administrative access controls.
- Ensure sensitive telemetry is displayed and accessed in accordance with approved data-handling and least-privilege requirements.
Requirements
- Bachelor’s degree in Computer Science, Information Technology, Engineering, or a related field; equivalent experience may substitute.
- 7+ years of experience in SRE, observability engineering, monitoring engineering, platform operations, DevOps, or production support.
- 3+ years of advanced Grafana administration, dashboard development, and alerting experience.
- Strong experience defining and operating SLIs, SLOs, error budgets, alerting standards, incident response, and post-incident improvement processes.
- Demonstrated ability to create usable dashboards and alerts from metrics, logs, traces, and event data.
- Proficiency in PromQL and/or LogQL; experience with Elastic Query DSL/KQL is strongly desired.
- Experience integrating alerts with ServiceNow, GitLab, webhooks, ticketing systems, and enterprise notification workflows.
- Experience with Kubernetes or OpenShift and cloud-native operational troubleshooting.
- Hands-on experience with Git, GitLab CI/CD, Grafana provisioning, GitOps, and configuration-as-code.
Skills
- Grafana
- Alerting
- PromQL
- LogQL
- Elastic Query DSL/KQL
- ServiceNow integration
- GitLab integration
- Webhook integration
- Ticketing system integration
- Enterprise notification workflow integration
- Kubernetes
- OpenShift
- Cloud-native troubleshooting
- Git
- GitLab CI/CD
- Grafana provisioning
- GitOps
- Configuration-as-code
- Grafana Enterprise
- Elastic
- Prometheus/Mimir
- Loki
- Tempo
- OpenTelemetry
- Grafana Alloy
- NIST SP 800-53
- NIST SP 800-137
- ICD 503
- RMF/ATO evidence
- FIPS constraints
Location
- Continental US
Work Type
- Full time
- Up to 10% Travel
Experience Level
- Senior
- 7+ years of experience
- 3+ years of advanced Grafana administration
Education Level
- Bachelor’s degree in Computer Science, Information Technology, Engineering, or a related field; equivalent experience may substitute.
Salary/Compensations
- $90,300-$189,600
Benefits
- Flexible time off
- Robust learning resources
- Healthcare
- Wellness
- Financial
- Retirement
- Family support
- Continuing education
About the Company
- At CACI, we place character and innovation at the center of everything we do.
- As a valued team member, you’ll be part of a high-performing group dedicated to our customer’s missions and driven by a higher purpose – to ensure the safety of our nation.
- CACI values the unique contributions that every employee brings to our company and our customers - every day.
- Together, we will advance our nation's most critical missions, build on our lengthy track record of business success, and find opportunities to break new ground — in your career and in our legacy.
Equal Opportunity
- CACI is an Equal Opportunity Employer. All qualified applicants will receive consideration for employment without regard to race, color, religion, sex, pregnancy, sexual orientation, age, national origin, disability, status as a protected veteran, or any other protected characteristic.